Key Takeaways
- Claude Opus 4.7 leads at 56.10%, a ceiling low enough that current AI cannot yet reliably grade student work. Only 16 models exceed 50% accuracy, with most others scoring substantially below.
- Current results show significant variation across model providers, but relatively little variation within each provider’s models.
- Smaller models often match or exceed the performance of larger ones, indicating that higher-cost models may offer limited benefit for education use cases.
Analysis of Model Bias
We found that some models graded student responses more harshly on average than others:
Our model examples bear this out - we found that Grok 4 grades harshly, while GPT 5 grades leniently. A similar investigation on the Calculus split found that (on average) two-thirds of model accuracy could be attributed to correct student responses, which represent only one-third of the student data! This suggests models have an easier time correctly identifying correct (as opposed to incorrect) student work.
Background
One of the most common use cases for AI on a per-query basis is education1-3. Unfortunately, much of that usage is for cheating rather than legitimate learning support4,5. Meanwhile, teachers spend a disproportionate amount of their time grading student work instead of teaching students directly6,7. This creates a significant opportunity for AI to support educators by automating the grading process. We benchmark models’ ability to support teachers in that grading process. By evaluating how well AI models can assess student work against established rubrics, we aim to understand whether current AI technology can meaningfully reduce the grading burden on educators while maintaining assessment quality and consistency. The SAGE (Student Assessment with Generative Evaluation) benchmark specifically focuses on mathematical problem-solving, where clear rubrics and objective criteria can be established for evaluation.
Dataset
The SAGE dataset comprises the following mathematical problem categories:
- Automata: Algorithmic thinking, computational problem-solving, and theory of formal languages
- Linear Algebra: Matrix operations, vector spaces, and linear transformations
- PDEs: Partial differential equations and their applications
Each category represents different aspects of mathematical reasoning and problem-solving that students encounter in advanced mathematics and computer science curricula. The diversity of problem types ensures that the benchmark captures a comprehensive view of how well AI models can assist in grading across various mathematical domains.
We found substantial variation on results across different subjects. We default to an Overall score which takes a class-balanced average across our three categories.
We also evaluated models on CollegeBoard’s public AP FRQ response samples for Precalculus as well as Calculus AB and BC. We publish these results as our public Calculus split. To prevent data contamination, these resutls are not included in the Overall metric.
If you are interested in licensing our held-out, private validation dataset, e-mail contact@vals.ai for more information.
Methodology
The models are given student work samples and corresponding rubrics, expressed as a set of potential point deductions. We ask the models to determine which deductions apply to the given work.
All student work in the dataset consists of handwritten mathematical solutions, which adds an additional layer of complexity as models must be able to parse handwritten text and mathematical notation.
The evaluation process requires models to:
- Parse and understand the rubric criteria
- Analyze the student’s mathematical work and reasoning
- Apply appropriate scoring based on the rubric guidelines
- Provide clear justification for their scoring decisions
This methodology tests not only the models’ mathematical understanding but also their ability to apply consistent evaluation standards—a critical skill for educational applications.
All models are evaluated with temperature 1, and produce at most 30K tokens (the length of a short book - more than enough to adequately grade student work).
Results
Correlation Between Subjects
We find that the subject-specific scores correlate, suggesting we’re measuring holistic ability rather than something subject-specific. Surprisingly, we find as much correlation between “unrelated” fields (like Linear Algebra and Automata) as between “similar” fields (like Linear Algebra and PDEs).
This correlation is seen in the spider graph below - models that score well on one subject tend to score well on all of them:
Less is More
One particularly striking trend we found was that additional compute tended not to help models:
- Chain-of-thought reasoning, the most popular form of inference-time compute, doesn’t seem to help the Claude models and even reduces the performance of Gemini 2.5 Flash by 5%!
- As mentioned above, smaller models tend to perform comparably to or better than larger ones. For instance, GPT 5.4 Mini scores 50.81% — placing 14th of 88 overall — while many larger, more expensive models score lower.
Grok 4 Failure Analysis
We found that Grok 4 particularly struggles, achieving 25% overall accuracy. We have a few potential explanations.
- While most other evaluated models support PDF upload via files API, Grok doesn’t - so we upload the documents as images.
- During the release livestream, Elon calls the model “Partially Blind” - it likely struggles to read our uploaded images.
- The model has a hard time converting qualitative analysis into quantitative responses. For instance, when asked for qualitative context on the example problem below, it gave a coherent response that demonstrated understanding of both the problem and of the student’s solution.
Model Examples
We’ve included an example model evaluation on student work to help contextualize our methodology and results:
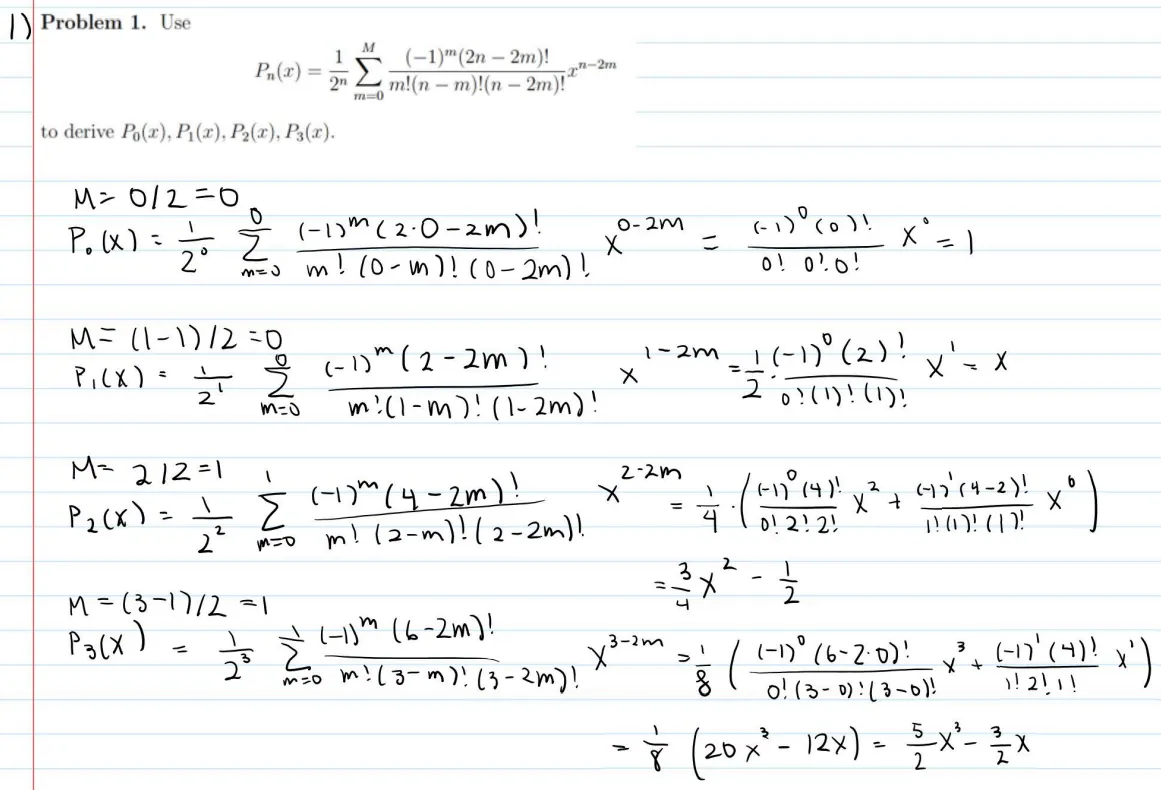
please grade problem 1 of the attached problem set according to the following rubric
Select all relevant entries - note that each rubric entry represents a deduction.
Total 12.5 points
12.5 pts Response is blank or unrelated
2 pts incorrect derivation of $P_0(x)$
2.5 pts incorrect derivation of $P_1(x)$
2 pts incorrect summation for $P_2(x)$
2 pts simplification error for $P_2(x)$
2 pts incorrect summation for $P_3(x)$.
2 pts simplification error for $P_3(x)$
INCORRECT
Harsh.
Note that the are Legendre Polynomials, letting us confirm that all but are correct.
Citations
[1] University students are using Claude: Anthropic Education Report
[2] Claude Economic index says that Education & Library is one of the top categories for AI usage according to anthropic: Anthropic Economic Index
[3] Microsoft AI in Education Report
[4] AI cheating and plagarism is the number one concern: Microsoft AI in Education Survey Data Page 14
[5] AI being applied in the classroom, rising concerns of plagiarism: Financial Times Article
[6] Education week: less than half of the time that teachers spend working is spent on actual teaching: Education Week Report
[7] time a teacher spends grading from Solved Consulting, an educational consulting firm: Solved Consulting Blog