Key Takeaways
- Claude Opus 4.7 is the current top performer on Finance Agent, scoring 64.37% accuracy. Claude Sonnet 4.6 follows with 63.33%, Muse Spark with 60.59%, DeepSeek V4 with 60.39%, and Claude Opus 4.6 (Thinking) with 60.05%.
- In the last six months, we’ve seen significant improvement on the benchmark - the capability of LLMs to take on financial tasks is dramatically increasing.
- Models on average performed best in the simple quantitative and qualitative retrieval tasks. These tasks are easy but time-intensive for finance analysts.
Background
The frontier of applied AI is agents – systems that independently direct their own processes to maintain control over how they accomplish tasks on behalf of users [1] [2]. As such, foundation model labs have invested heavily in developing agents that can handle complex tasks [3], making them prime candidates for delivering significant ROI in specialized industries [1] [4].
Finance is one of the most lucrative applications of agents [5], where AI has the potential to drive significant efficiency gains by performing tasks that mirror those of an entry-level financial analyst [6]. Yet, there lacks a framework for evaluating these agents [7], highlighting the need for standardized evaluation methods to measure agentic ability on domain-specific tasks.
We have created a benchmark that tests the ability of agents to perform tasks expected of an entry-level financial analyst. In collaboration with Stanford researchers, a Global Systemically Important Bank, and industry experts, we created a dataset of 537 questions that evaluate skills such as simple retrieval, market research, and projections.
Results
The Pareto cost-curve above illustrates the relationship between model accuracy and cost per session across different models. As model performance improves, these cost considerations will likely be more important.
Some challenging queries cost more than $5 for o3 or Claude Opus 4.1 (Thinking). Often, performance can be improved by allowing the model more tool calls and more tokens used, but this comes at a cost.
The tool call analysis reveals how many steps the models take to produce an answer. Interestingly, the top performers on this benchmark also register relatively high numbers of tool calls. This suggests that their comparatively strong performance on financial analyst tasks is partly due to leveraging the tools provided. It also reveals certain top models are making multiple tool calls per turn.
The spider graph detailing the number of tool calls performed by each model further supports the notion that the number of tool calls generally leads to higher accuracy. Again, we see several of the top models excelling by making many tool calls, especially for retrieving information, parse html_page, and Google web-search, which leads to top benchmark performance.
Model Output Examples
Calculate the % Change in the Total Number of Common Stock Shares Repurchased by Netflix (NASDAQ: NFLX) in Q4 2024 vs Q4 2023.
1
The right answer we were looking for was “2024 - 1,165,827. 2023 - 5,477,608. The number of shares repurchased by the company decreased by 79% in 2024”. To answer this question, the finance expert did the following:
- Go to Edgar
- Search Netflix Filings by Ticker
- Identify the 10-K for 2024 and the 10-K for 2023
- Search for Company Purchases of Equity Securities
- Calculate the Total Number of Shares Purchased from Oct 1, 2024 - Dec 31, 2024
- Calculate the Total Number of Shares Purchased from Oct 1, 2023 - Dec 31, 2023
- Calculate the Percent Change in Total Number of Shares Purchased from 2023 to 2024
Trajectory Comparison
The visualizations below illustrate the sequence and types of tool calls made by two models for the example question above. Each node represents a step in the model’s reasoning process, with colored nodes indicating specific tool calls. These trajectories reveal how models approach research tasks, with more thorough tool usage often correlating with better performance.
Claude Sonnet 4.5 (Thinking) trajectory:

We see that Claude Sonnet 4.5 (Thinking)‘s trajectory follows what we’d expect intuitively— an initial edgar_search (corresponding to going to EDGAR and searching for Netflix filings by ticker), followed
by parse_html_page, and finally retrieve_information.
Gemini 2.5 Pro Preview trajectory:
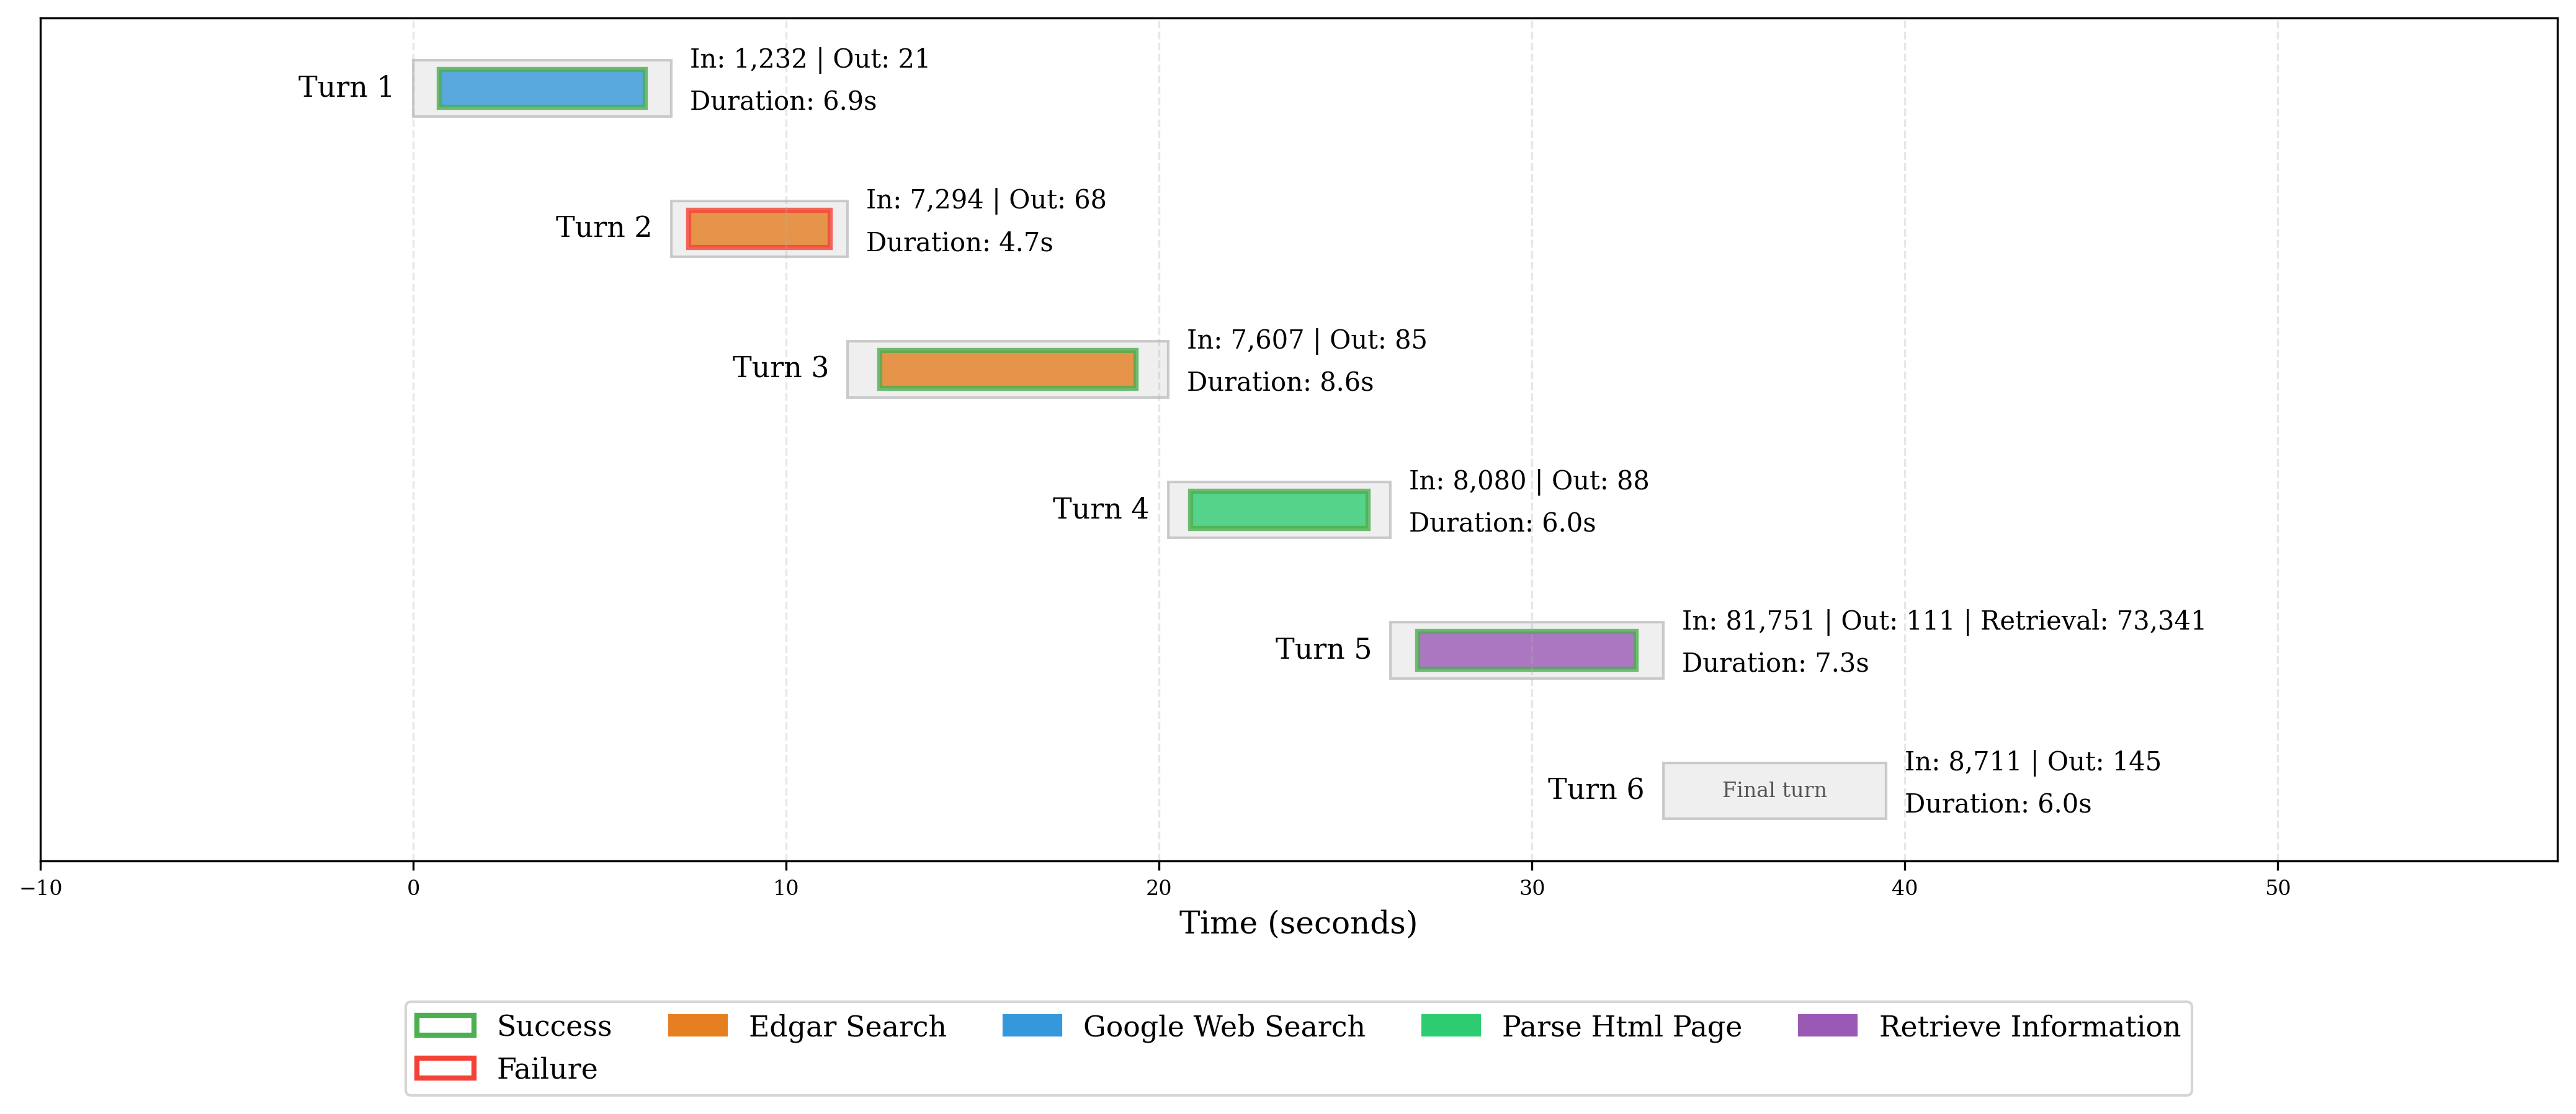
In the case of Gemini 2.5 Pro Preview, it follows roughly the same pattern as Claude Sonnet 4.5 (Thinking), except the model is also able to recover from a failed tool call!
Methodology
The finance industry comprises a wide array of tasks, but through consultation with experts at banks and hedge funds, we identified one core task shared across nearly all financial analyst workflows: performing research on the SEC filings of public companies. This task —while time-consuming— is foundational to activities such as equity research, credit analysis, and investment due diligence. We collaborated with industry experts to define a question taxonomy, write and review 537 benchmark questions.
The AI agents were evaluated in an environment where they had access to tools sufficient to produce an accurate response. This included an EDGAR search interface via the SEC_API, Google search, a document parser (ParseHTML) for loading and chunking large filings, and a retrieval tool (RetrieveInformation) that enabled targeted questioning over extracted text. The human experts did not make use of any additional tools when writing and answering their questions. See the full harness in the Finance Agent GitHub repository.
Our primary evaluation metric was final answer accuracy (see the GAIA benchmark). We also recorded latency, tool utilization patterns, and associated computational cost to provide a fuller picture of agent efficiency and practical viability. Together, these components form a rigorous and domain-specific evaluation framework for agentic performance in finance, advancing the field’s ability to measure and rely on AI in high-stakes settings.

The code behind this harness is open source. Dive in and explore it yourself on this repo!
Dataset
The dataset is divided into three parts: Public Validation (50 open-source samples), Private Validation (150 samples available for license), and Test (337 samples).
-
The Public Validation set is fully open.
-
The Private Validation set is available for license. Interested parties are encouraged to contact us directly for access.
-
The Test set will remain private permanently. All results reported in this page are based solely on the Test set to prevent potential future overfitting.
The dataset splits were sampled to preserve the distribution of question types and performance characteristics. We observed a strong correlation in performance across the validation sets and the Test set, supporting the reliability of these splits.
Question Taxonomy
Quantitative Retrieval (easy)
Direct extraction of numerical information from one or more documents without any post-retrieval calculation or manipulation.
What was the quarterly revenue of Salesforce (NYSE:CRM) for the quarter ended December 31, 2024?
Qualitative Retrieval (easy)
Direct quotation or summarization of non-numerical information from one or more documents.
Describe the product offerings and business model of Microsoft (NASDAQ:MSFT)?
Numerical Reasoning (easy)
Calculations or aggregation of key numbers to produce an answer.
What is % of revenue derived from AWS in each year and the 3 year CAGR from 2021-2024 of Amazon?
Complex Retrieval (medium)
Numerical or non-numerical retrieval or content summarization requiring synthesis of information from multiple documents.
Please briefly summarize the most recent capital raise conducted by Viking Therapeutics (NASDAQ:VKTX).
Adjustments (medium)
Quantitative and qualitative analysis of reporting context bridging GAAP and Non-GAAP Financial Metrics.
What is Lemonade Insurance’s Adjusted EBITDA for the year ended December 31, 2024?
Beat or Miss (medium)
Comparison of forward management guidance versus actuals, synthesized by reconciling sequential quarterly reporting documents.
How did Lam Research’s revenue compare to management projections (at midpoint) on a quarterly basis in 2024? Format as % BEAT or MISS. Use guidance provided on a quarterly basis.
Trends (hard)
Analyze patterns within a single company’s reporting structure or calculate and contextualize evolving performance, key metrics or business composition.
Which Geographic Region has Airbnb (NASDAQ: ABNB) experienced the most revenue growth from 2022 to 2024?
Financial Modeling (hard)
Complex numerical reasoning calculations which require additional financial expertise to define and evaluate.
How much M&A firepower does Amazon have as of FY2024 end including balance sheet cash, non-restricted cash and other short term investments, and up to 2x GAAP EBITDA leverage? Round to nearest billion
Market Analysis (hard)
Advanced analysis of one or more companies using various documents, requiring normalization of comparison metrics, or complex reasoning and usage of causality to contextualize drivers of business changes or competition dynamics.
Compare the quarterly revenue growth of FAANG companies between 2022-2024.
Finance Agent v1.1
At the beginning of 2026, we performed a refresh of the data, the harness, and the evaluation methodology to ensure the benchmark remains at an extremely high standard. The primary changes are as follows:
Data
- AfterQuery ran quality control on the benchmark data using finance experts from leading global investment banks, private equity firms, and hedge funds, including Goldman Sachs, Silver Lake, and Citadel.
- We switched many of the questions from relative dates (e.g., “current year”, “last three quarters”) to absolute dates (“April 2025”, “Q1–Q4 2024”). This is in addition to the pre-existing instructions in 1.0, which instruct the model to “answer each question as if today was 4/7/25.”
Harness
- The search tool was switched from Serp API to Tavily.
- Model submission is now via a
submittool call rather than extracted from the message history. - The prompt template was updated to better instruct the model on including supporting reasoning and evidence in its final answer.
- The CIK parameter in the SEC search is now optional.
- Additional instructions on how to use the data storage were added to the prompt template.
- The system prompt was also modified to instruct the model to give answers to two decimal places and not round any intermediate calculations.
Evaluation
- The evaluator model was upgraded to GPT-5.2.
- The LLM-as-judge now uses the mode of three evaluations to reduce variance.
- Clearer guidelines on dealing with rounding were added to the LLM-as-Judge prompt.
All models were re-run from scratch using the FAB v1.1 harness and data.
Acknowledgements
Thanks to the following people for their support: Shirley Wu, Alfston Thomas, Andrew Schettino, Kathy Ye, Kyle Jung, Matthew Friday, Michael Xia, and Nicholas Crawley-Brown.
For v1.1, thank you to Spencer Mateega, Sam Jacob, and the AfterQuery team for their support and review of the data.
Citation
If you use this benchmark in your research, please cite the paper.
Citation (BibTeX)
@misc{bigeard2025fab,
title        = {Finance Agent Benchmark: Benchmarking LLMs on Real-world Financial Research Tasks},
author       = {Bigeard, Antoine and Nashold, Langston and Krishnan, Rayan and Wu, Shirley},
year         = {2025},
month        = may,
howpublished = {Vals AI},
url          = {https://arxiv.org/abs/2508.00828},
}