Background
A decision model takes a situation and a fixed list of options and returns a probability for each. Most tests of these models ask independent questions, one at a time. In a business, every choice changes the next situation, and its result may not show for months.
RollerCoaster Tycoon 2, a theme park management game from 2002, is a compact version of that problem. A park grows by balancing rides, prices, staff, marketing, and debt. Building too slowly leaves guests with nothing to do, building too fast runs out of cash, and prices that are too high or too low both cost guests. The game’s windows show everything that matters as numbers and lists, so the whole state can be written as text.
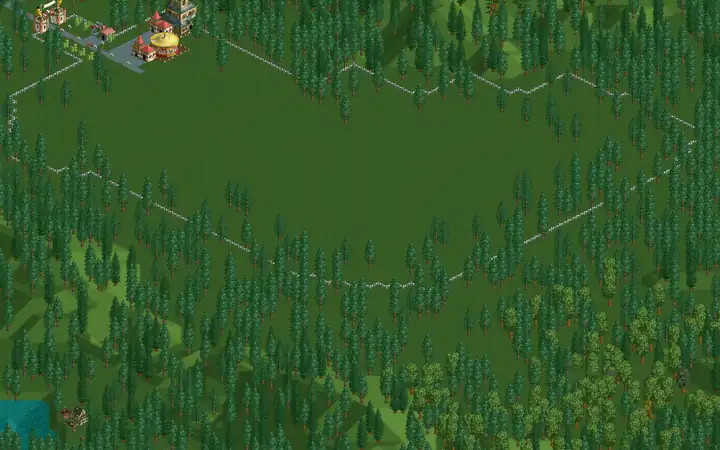
RollerCoasterTycoonBench uses the Forest Frontiers scenario. The park starts as an empty clearing with $10,000 in cash and a $10,000 loan, which the bank will raise to $30,000. The scenario’s own goal is 250 guests at the end of the first year. We raised it to 1,000 guests and a park rating of 600 at the end of October in year 3. The game rates parks from 0 to 999. That is 96 weekly turns: the game’s year runs from March to October, four weeks a month.
Our write-up covers what the models did and how harness design choices affect their behavior.
Methodology
We run OpenRCT2, the open-source RollerCoaster Tycoon 2, headless on the original game data. All models use the same harness, which pauses the game once a week for the model to take a turn. Each model plays three runs. Models whose providers cap input length or option count below what a game needs are not on the leaderboard.
| Turn | The model opens up to six of the game’s windows, one at a time, makes one change in each, and then chooses “done” to let the week pass. The windows are construction, paths, land, staff, an attraction, marketing, finances, and research. |
| Questions | Each window asks short multiple-choice questions. A build goes item → area → spot → rotation, and the last option states the tiles, paths, trees cleared, and total price. |
| Options | Generated from the live game, so every option is legal and affordable at that moment, and shuffled on every call. |
| State | Everything a player can see, written as text: the park, finance, and ride windows, staff, guests’ needs and thoughts, a text map, the construction lists with prices and ride ratings, and a history of the last eight weeks. It contains no strategy hints. |
| Answer | A probability for each option. The harness carries out the most likely one. |
The harness does the spatial work a player does with the mouse. It finds build sites that connect to the paths, lays the footpaths to them, and prices each option from the game itself. The model decides what to build, where, and when.
We audit every run’s trace. Each pick must be one of the listed options, the cash spent must match the stated price, each action must change the game as described, and the state the model saw must match the game’s own records. If a provider refuses a call, the harness takes no action on it, and the run explorer marks the call.
Scoring
A run’s score has two halves. The first is the share of the goal it meets: the lower of guests ÷ 1,000 and park rating ÷ 600, capped at 1. The second is company value ÷ $100,000, between 0 and 1. Company value is park value plus cash, minus the loan, and the game records it as the high score when a player completes a scenario. Park value adds up each ride’s value, plus $7 per guest. A ride’s value depends on its ratings and how many guests rode it recently, and is higher in its first 13 months, so a ride built just before the deadline adds slightly more value, though its price comes out of cash. Company value starts at $0, since the park’s cash equals its loan. A run with 900 guests, a passing rating, and $40,000 in company value scores 65%.
Each time a park loads, the game draws a new random seed, which changes guest behavior and ride breakdowns, and the harness shuffles the options on every call. Runs by the same model can end far apart, so we report each model’s mean score over its three runs, with the standard error. Cost is the billed price of a run’s calls, averaged over runs, and time is the mean number of seconds per call.
Results
Decider V1.3 has the highest mean score, 70.96%. The chart shows each model’s guests week by week.
Example decisions
Each example below is one decision from the traces, with the state the model was given and the probabilities it returned.
- Guests
- 265
- Rating
- 759
- Cash
- $566
- Loan
- $11,000 / $30,000
- Attractions
- 17
- Staff
- 0
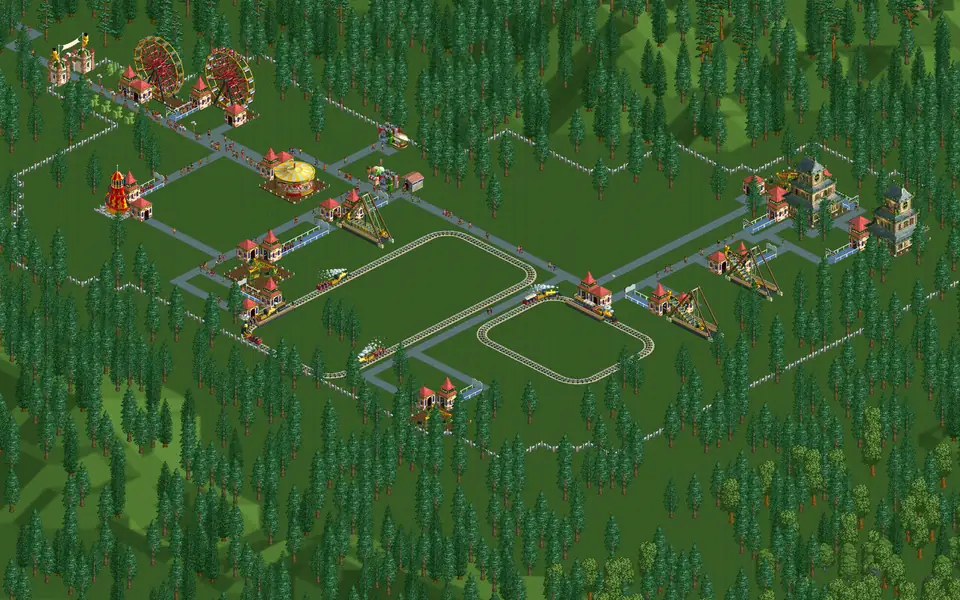
52 guests thought Miniature Railroad 2 was really good value at $1.10. GPT-6 Luna Decisions raised the price by ten cents (86%).
State
{
 "attractions": [
  {
   "id": 11,
   "map_letter": "M",
   "name": "Miniature Railroad 2",
   "object": "Steam Trains",
   "object_identifier": "rct2.ride.nrl",
   "classification": "ride",
   "status": "open",
   "breakdown": "none",
   "price": [
    1.1
   ],
   "excitement": 3.3,
   "intensity": 0.24,
   "nausea": 0.02,
   "total_customers": 96,
   "guests_on_ride": 18,
   "income_per_hour": 897.6,
   "running_cost_per_hour": 116.8,
   "profit_per_hour": 780.8,
   "total_profit": 103.7,
   "popularity_percent": 48,
   "satisfaction_percent": 75,
   "reliability_percent": 97,
   "downtime_percent": 0,
   "age_months": 2,
   "inspection": "every 30 minutes",
   "operating_mode": "continuous circuit",
   "min_wait_s": 10,
   "max_wait_s": 60,
   "vehicles": 4,
   "cars_per_train": 3,
   "ride_type": "miniature_railway",
   "departure": {
    "wait_for_load": false,
    "load": "full load",
    "minimum_waiting_time_on": true,
    "maximum_waiting_time_on": false,
    "leave_if_another_train_arrives": false,
    "synchronise_with_adjacent_stations": false
   },
   "music": "off",
   "stats": {
    "max_speed_mph": 10,
    "average_speed_mph": 7,
    "ride_time_s": 53,
    "ride_length_m": 219,
    "max_positive_vertical_g": 1,
    "max_negative_vertical_g": 1
   },
   "stations": [
    {
     "start_tile": [
      62,
      48
     ],
     "entrance_tile": [
      62,
      47
     ],
     "exit_tile": [
      64,
      47
     ],
     "queue_time": 2
    }
   ]
  }
 ],
 "guests.thoughts": {
  "“I’m not hungry”": 106,
  "“I’m not thirsty”": 67,
  "“Miniature Railroad 2 is a really good value”": 52,
  "“This park is really clean and tidy”": 39,
  "“I want to go on something more thrilling than Miniature Railroad 2”": 39,
  "“I want to go on something more thrilling than Ferris Wheel 1”": 39,
  "“I want to go on something more thrilling than Spiral Slide 1”": 37,
  "“The music is nice here”": 35,
  "“Miniature Railroad 2 was great”": 33,
  "“Twist 1 was great”": 31,
  "“I want to go on something more thrilling than Pirate Ship 1”": 30,
  "“Spiral Slide 1 is a really good value”": 25
 }
}An attraction's window › Miniature Railroad 2 › Price
- Raise Miniature Railroad 2 to $1.20.86%
- Lower Miniature Railroad 2 to $0.10.0.0%
- Raise Miniature Railroad 2 to $2.10.1.0%
- Lower Miniature Railroad 2 to $0.60.0.0%
- Raise Miniature Railroad 2 to $1.60.9.0%
- Lower Miniature Railroad 2 to $1.00.3.0%
- Make Miniature Railroad 2 free ($0.00).0.0%
- Raise Miniature Railroad 2 to $3.10.1.0%
Explore every run
The explorer replays any run. Pick a model and a run, then step or play through the 96 weeks. The picture shows the park at the start of each month, and the panel lists each week’s decisions, with all the options in the order the model saw them, the probability it gave each, and the one the harness carried out. For the featured runs, which the State tab names, it shows the full text the model received each week.
 Mar, year 1, week 1
- Guests
- 0
- Rating
- 0
- Cash
- $10,000
Loading the run…
Discussion
A model can pick only from the options the harness gives it, so choices such as option order, the stated objective, and whether prices are listed affect scores. The write-up measures their effect. Three runs per model is a small sample for a game this random, so read the model means with their standard errors.
Version 1 leaves out free-form path drawing, the chairlift, custom coaster track, large scenery, water, cosmetic changes, and the game’s other scenarios.